


Abstract
Short sleep duration, which is associated with increased morbidity and mortality, has been shown to vary by occupation and industry, but few studies have investigated differences between black and white populations. By using data from a nationally representative sample of US adult short sleepers (n = 41,088) in the National Health Interview Survey in 2004–2011, we estimated prevalence ratios for short sleep duration in blacks compared with whites for each of 8 industry categories by using adjusted Poisson regression models with robust variance. Participants' mean age was 47 years; 50% were women and 13% were black. Blacks were more likely to report short sleep duration than whites (37% vs. 28%), and the black-white disparity was widest among those who held professional occupations. Adjusted short sleep duration was more prevalent in blacks than whites in the following industry categories: finance/information/real estate (prevalence ratio (PR) = 1.44, 95% confidence interval (CI): 1.30, 1.59); professional/administrative/management (PR = 1.30, 95% CI: 1.18, 1.44); educational services (PR = 1.39, 95% CI: 1.25, 1.54); public administration/arts/other services (PR = 1.30, 95% CI: 1.21, 1.41); health care/social assistance (PR = 1.23, 95% CI: 1.14, 1.32); and manufacturing/construction (PR = 1.14, 95% CI: 1.07, 1.20). Short sleep generally increased with increasing professional responsibility within a given industry among blacks but decreased with increasing professional roles among whites. Our results suggest the need for further investigation of racial/ethnic differences in the work-sleep relationship.
Studies suggest that mean sleep duration among US adults has decreased over time (1), which is of public health concern because insufficient sleep has been linked to increased risk of poor health (self-reported), weight gain and obesity, hypertension, diabetes, coronary heart disease, and mortality (2–12). The prevalence of short sleep duration has been shown to vary by industry and occupation among US workers (13, 14), with work affecting sleep through several factors, including long/extended work hours, rotating or shift work, and job-related stress (14–18). The internet and email capabilities, cellular phones, and other communication devices have resulted in employees becoming perpetually available and capable of communicating and engaging in work in ways and during times that may displace sleep (19, 20).
US blacks may be at particularly high risk for insufficient sleep-related morbidity and mortality (21, 22), and racial differences in sleep duration by industry and occupation may arise for various reasons. For instance, blacks employed across various industries are more likely to work nontraditional shifts with nonstandard work schedules (especially night shifts) and to have long working hours, which can negatively affect health through insufficient sleep duration by, for example, disrupting circadian rhythms and increasing one's appetite for sweet and salty foods (22–31). Compared with whites, blacks are also more likely to report general job stress, to experience objective and perceived discrimination, to work in positions with low control/high demand and that involve low decision-making power, to work multiple low-wage jobs, and to live in poverty despite being employed (26, 27, 32–38).
Understanding the impact of occupation and industry of employment on sleep, as well as how blacks and whites may be differentially affected, can help identify racial disparities and enable the creation of tailored, mitigating interventions. However, few studies have investigated black-white differences in the work-sleep relationship. Therefore, we sought to examine racial/ethnic differences in short sleep duration by industry of employment by using a nationally representative sample of US adults reporting short sleep duration in the National Health Interview Survey (NHIS) from 2004 to 2011. We hypothesized that 1) the prevalence of short sleep duration would increase for both blacks and whites; 2) blacks compared with whites would have a consistently higher prevalence of short sleep duration across industries; and 3) these racial/ethnic disparities would persist over the study period.
MATERIALS AND METHODS
The National Health Interview Survey
We analyzed data from the NHIS, which is a series of cross-sectional, nationally representative surveys that use a 3-stage stratified cluster probability sampling design to conduct in-person interviews in households of noninstitutionalized US civilians. A detailed description of NHIS procedures is available elsewhere (39). Briefly, each week (on a continuous basis), a probability sample of households was interviewed by trained interviewers from the US Census Bureau (Spauldings, Maryland) to obtain information about health and other characteristics of each member of the sampled households. The data collection interviews were conducted through computer-assisted personal interviewing. From each sampled family, 1 adult and 1 child were randomly selected to provide additional health-related information. The final response rate for sampled adults, who were the basis for this analysis, was 67% (range, 61%–72%). Our study was approved by the Harvard School of Public Health's institutional review board.
Study participants
Participants included self-reported non-Hispanic white or non-Hispanic black (hereafter, white and black) adults aged 18 years and older. Participants were excluded if they 1) were born outside the US; 2) had an extreme body mass index (BMI) (calculated as weight (kg)/height (m)2) value of less than 15 or greater than 70; or 3) had missing data on sleep, industry of employment, or employment status. Our final sample comprised 136,815 adults, of whom 41,088 (30%) were considered short sleepers (<7 hours/day), 41,495 (31%) were considered optimal sleepers (7 hours/day), and 54,232 (39%) were considered long sleepers (>7 hours/day) (Supplementary Data, available at http://aje.oxfordjournals.org/). We excluded non–US born participants because evidence suggests that sleep patterns among US immigrants differ from those among individuals born in the United States (40). Military personnel were excluded because the NHIS is not designed to provide accurate estimates in this population.
Measures
Sleep duration
Sampled adults who were 18 years of age or older reported how many hours they sleep, on average, in a 24-hour period. Interviewers were instructed to report the hours of sleep in whole numbers, rounding values of 30 minutes or more up to the nearest hour and rounding values less than 30 minutes down to the nearest hour. Short sleep duration was defined as a usual sleep duration of less than 7 hours; optimal sleep was defined as 7 hours; and long sleep was defined as more than 7 hours. Seven hours of sleep was used as the reference because it is associated with the lowest levels of morbidity and mortality (8, 12).
Race/ethnicity
Participants were asked, “What race or races do you consider yourself to be?” They then selected 1 or more of the following categories: white, black/African American, American Indian/Alaskan native, Asian, or multiple races. Our analysis focuses on blacks/African Americans and whites because the underlying biological and social mechanisms leading to differences in sleep duration are likely to vary by race/ethnicity, and whites are customarily used as the comparison group for greater statistical stability because they have the largest sample size.
Industry of occupation
We grouped the North American Industrial Classification System (NAICS) (NAICS Association, LLC, Rockaway, New Jersey) codes into 8 meaningful industry categories as follows: 1) agriculture, forestry, fishing, and hunting (NAICS code 11); mining (NAICS code 21); utilities (NAICS code 22); construction (NAICS code 23); manufacturing (NAICS codes 31–33); wholesale trade (NAICS code 42); and transportation and warehousing (NAICS codes 48–49); 2) retail trade (NAICS codes 44–45); 3) information (NAICS code 51); finance and insurance (NAICS code 52); and real estate rental and leasing (NAICS code 53); 4) professional, scientific, and technical services (NAICS code 54); management of companies and enterprises (NAICS code 55); and administrative and support and waste management and remediation services (NAICS code 56); 5) educational services (NAICS code 82); 6) health care and social assistance (NAICS code 62); 7) accommodation and food services (NAICS code 72); and 8) other services (except public administration) (NAICS code 81); public administration (NAICS code 92); and arts, entertainment, and recreation (NAICS code 71).
Employment and socioeconomic status
Employment status in the week prior to the interview was ascertained for all adults and was categorized as “working for pay,” “working without pay,” “job not at work” (meaning the subject held a job but did not work in the week prior to the interview), “unemployed,” or “not in the labor force.” Educational attainment was categorized as less than high school (no high school diploma), high school (high school or general equivalency diploma), and greater than high school (any education beyond high school). Annual household income was dichotomized as above or below $35,000, and poverty status was based on being below the poverty line after the participants' best estimates of total income of all family members from all sources before taxes. Adults who were working at a paying or nonpaying job during the week prior to the survey, those who had a job or business but were not at work during the prior week, and those who ever worked were asked about their occupations, which were categorized on the basis of the Standard Occupational Classification System (http://www.bls.gov/soc/). We combined occupations into categories of professional/management, support services, or laborers on the basis of type of work. Class of work/occupation (based on current, longest held, or most recently held job or work situation) was classified as either 1) an employee of a private company, business, or individual for wages, salary, or commission; 2) a federal, state, or local government employee; 3) self-employed in own business, professional practice, or farm; or 4) working without pay in a family-owned business or farm.
Health behaviors
Smoking status and lifetime alcohol drinking status were categorized as “ever” or “never.” Leisure-time physical activity was categorized as “none,” “low,” or “high.” Participants who engaged in at least some level of activity and who provided a specific number of activity bouts were dichotomized at the midpoint of these bouts and classified as having activity levels of “low” or “high.” Participants reporting “never” or “unable to do this type activity” were categorized as “none.”
Medical conditions
Sampled adults were asked if they had ever been told by a doctor or other health professional that they had “hypertension, also called high blood pressure” and, separately, if they had “diabetes or sugar diabetes.” Participants were also asked if a doctor or other health professional had ever diagnosed them as having any kind of heart condition or disease other than coronary heart disease, angina pectoris, or a myocardial infarction, as well as if a doctor or other health professional had ever diagnosed them as having coronary heart disease. We combined these variables to adjust for heart disease.
Covariates
Self-reported height and weight were used to calculate BMI. Obesity was defined as a BMI value of 30 or higher, overweight as 25.0–29.9, normal weight as 18.5–24.9, and underweight as less than 18.5 (19). Marital status was categorized as married/living with a partner, divorced/separated/widowed, or never married. Regions of the country were categorized as South, Midwest, Northeast, or West. Self-reported general health status was categorized as excellent/very good, good, or fair/poor.
Statistical analysis
We pooled 8 survey years (2004–2011) of NHIS data merged by the Integrated Health Interview Series (https://www.ihis.us/ihis/). For all analyses, we used sampling weights that account for the unequal probabilities of selection resulting from the sample design, nonresponse, and oversampling of certain subgroups. Standard errors or variance estimations were calculated by using Taylor series linearization (41). Stata, version 12, software (StataCorp LP, College Station, Texas) was used for all analyses.
Continuous variables were expressed as means and standard errors, whereas categorical variables were presented as absolute values with corresponding percentages. We used Rao-Scott second-order corrected Pearson statistics that take survey weights into account to test for differences in prespecified sociodemographic, clinical, and behavioral characteristics of interest between whites and blacks, as well as sleep duration (41).
To estimate prevalence ratios for short sleep duration among blacks compared with whites by industry, we used 5 different Poisson regression models with a robust variance estimator (43). Prespecified socioeconomic, health behavior, demographic, and clinical characteristics were entered into the model as a group in an inclusive stepwise manner, and white participants were used as the reference for the black-white comparisons. For models stratified by race for blacks and whites, as well as for a separate model with an interaction term for race and sleep, we first adjusted for age in 3 categories (18–49 years, 50–64 years, or ≥65 years) and then for demographic factors (i.e., sex, marital status, and educational attainment) in our second model. We subsequently adjusted for health behaviors, including smoking status, alcohol consumption, and leisure-time physical activity in the third model before adjusting for self-reported health status, hypertension, heart disease, diabetes, cancer, and 4 standard BMI categories in the fourth model. The final model adjusted for living in poverty, class of occupation, occupation, and annual household income above or below $35,000.
To test for race-specific temporal trends in short sleep duration over time by industry of employment, we again used Rao-Scott second-order corrected Pearson statistics for each industry among blacks and whites, separately. To test for potential black-white differences in the prevalence of short sleep duration in a pooled analysis, we introduced interaction terms for race and survey year with 2 years combined for separate linear regression models.
RESULTS
Characteristics of the study population
Among the 136,815 participants, the mean age was 47 years; 50% were women; 13% were black; 28% (for whites, 30%; for blacks, 17%) had at least a college education; and 29% reported short sleep duration. Table 1 shows weighted estimates of the age-adjusted prevalence of short sleep duration by sociodemographic, health behavior, and clinical characteristics among black and white participants. Supplementary Data displays the mean or prevalence of these characteristics by race/ethnicity among those with short sleep duration. Blacks were more likely than whites to experience short sleep duration (37% vs. 28%). For both blacks and whites, there were no apparent differences in short sleep duration by sex. Regarding education, the greatest prevalence of short sleep duration was among white high school graduates (36%) and among blacks with some college (41%). The prevalence of short sleep duration among individuals living in poverty was similar for both blacks and whites. The overall percentage point difference in short sleep duration between blacks and whites was 16 for those in professional/administrative/management positions, 11 for those in support services, and 4 for laborers.
Age-adjusted Prevalence of Short Sleep Durationa by Sociodemographic, Health Behavior, and Clinical Characteristics Among 136,815 Black and White Participants, United States, 2004–2011
| Characteristic | Whites | Blacks | Both Races Combined | |||
|---|---|---|---|---|---|---|
| No. | % | No. | % | No. | % | |
| Short duration sleepers (sample) | 31,752 | 28 | 9,336 | 37 | 41,088 | 29 |
| Age group, years | ||||||
| 18–49 | 17,305 | 31 | 5,649 | 40 | 22,954 | 33 |
| 50–64 | 8,905 | 29 | 2,456 | 40 | 11,361 | 31 |
| ≥65 | 5,542 | 21 | 1,231 | 29 | 6,773 | 22 |
| Women | 16,450 | 28 | 5,602 | 38 | 22,052 | 29 |
| Men | 15,302 | 28 | 3,734 | 37 | 19,036 | 29 |
| Educational attainment | ||||||
| Less than high school | 10,053 | 31 | 2,882 | 34 | 12,935 | 31 |
| High school graduate | 3,132 | 36 | 1,342 | 35 | 4,474 | 36 |
| Some college | 10,656 | 30 | 3,461 | 41 | 14,117 | 31 |
| ≥College degree or higher | 7,911 | 22 | 1,651 | 39 | 9,562 | 24 |
| Marital status | ||||||
| Married | 14,842 | 26 | 2,464 | 37 | 17,306 | 27 |
| Divorced/separated/ widowed | 10,361 | 35 | 3,281 | 38 | 13,642 | 36 |
| Never married | 6,482 | 28 | 3,558 | 37 | 10,040 | 30 |
| Region of country | ||||||
| Northeast | 5,797 | 30 | 1,205 | 40 | 7,002 | 31 |
| Midwest | 9,477 | 28 | 1,944 | 40 | 11,421 | 29 |
| South | 10,806 | 28 | 5,294 | 36 | 16,100 | 30 |
| West | 5,672 | 26 | 893 | 39 | 6,565 | 27 |
| Living in poverty | 3,341 | 37 | 2,085 | 38 | 5,426 | 37 |
| Household income <$35,000/year | 17,392 | 27 | 3,618 | 38 | 21,010 | 28 |
| Class of worker | ||||||
| Private wage | 23,627 | 29 | 6,682 | 36 | 30,309 | 30 |
| Government | 5,176 | 26 | 2,193 | 39 | 7,369 | 28 |
| Self-employed | 2,773 | 25 | 408 | 37 | 3,181 | 26 |
| Occupation | ||||||
| Professional/ management | 5,957 | 25 | 1,106 | 41 | 7,063 | 27 |
| Support services | 14,092 | 27 | 4,446 | 38 | 18,538 | 28 |
| Laborer | 11,461 | 32 | 3,704 | 36 | 15,165 | 33 |
| Industry | ||||||
| Manufacturing/ constructionb | 10,133 | 30 | 2,343 | 37 | 12,476 | 31 |
| Retail trade | 3,576 | 29 | 793 | 34 | 4,369 | 30 |
| Finance/ information/real estatec | 2,769 | 25 | 722 | 38 | 3,491 | 27 |
| Professional/ administrative/ managementd | 2,932 | 25 | 842 | 38 | 3,774 | 27 |
| Educational services | 2,661 | 23 | 858 | 37 | 3,519 | 24 |
| Health care/social assistance | 3,986 | 29 | 1,814 | 39 | 5,800 | 31 |
| Accommodation/ food services | 1,926 | 33 | 592 | 34 | 2,518 | 33 |
| Public administration/ arts/other servicese | 3,649 | 27 | 1,329 | 38 | 4,978 | 29 |
| Health behavior | ||||||
| Smoking status | ||||||
| Never | 14,732 | 26 | 5,492 | 36 | 20,224 | 27 |
| Current | 8,034 | 28 | 1,551 | 39 | 9,585 | 29 |
| Former | 8,958 | 34 | 2,283 | 37 | 11,241 | 35 |
| Alcohol consumption | ||||||
| Never | 3,546 | 27 | 1,862 | 33 | 5,408 | 28 |
| Current | 18,376 | 27 | 4,528 | 39 | 22,904 | 28 |
| Former | 4,731 | 32 | 1,382 | 36 | 6,113 | 33 |
| Leisure-time physical activity | ||||||
| Never/unable | 10,950 | 31 | 4,057 | 36 | 15,007 | 32 |
| Low | 10,298 | 27 | 2,813 | 38 | 13,111 | 28 |
| High | 10,391 | 27 | 2,436 | 38 | 12,827 | 28 |
| Clinical characteristic | ||||||
| Overweight/ obesef | 20,957 | 30 | 7,129 | 38 | 28,086 | 30 |
| Obeseg | 9,783 | 33 | 4,030 | 39 | 13,813 | 34 |
| Hypertension (yes) | 10,425 | 32 | 3,978 | 39 | 14,403 | 33 |
| Diabetes (yes) | 2,747 | 33 | 1,239 | 40 | 3,986 | 35 |
| Heart disease (yes) | 4,269 | 32 | 991 | 39 | 5,260 | 34 |
| Cancer (yes) | 3,335 | 31 | 459 | 42 | 3,794 | 32 |
| Health status | ||||||
| Excellent/very good | 17,800 | 25 | 4,145 | 34 | 21,945 | 26 |
| Good | 8,751 | 31 | 2,933 | 37 | 11,684 | 32 |
| Fair/poor | 5,184 | 40 | 2,255 | 44 | 7,439 | 41 |
Abbreviation: NAICS, North American Industrial Classification System.
a Weighted estimates.
b Includes the following NAICS (NAICS Association, LLC, Rockaway, New Jersey) industry categories: agriculture, forestry, fishing, and hunting; mining; utilities; construction; manufacturing; wholesale trade; and transportation and warehousing.
c Includes the following NAICS industry categories: information; finance and insurance; and real estate rental and leasing.
d Includes the following NAICS industry categories: professional, scientific, and technical services; management of companies and enterprises; and administrative support and waste management and remediation services industries.
e Includes the following NAICS industry categories: public administration; arts, entertainment, and recreation; and other services (except public administration).
f Overweight/obese is defined as a body mass index (weight (kg)/height (m)2) value of 25 or higher.
g Obese is defined as a body mass index value of 30 or higher.
Black-white differences in short sleep duration by industry and occupation
Table 2 shows the adjusted prevalence ratios of short sleep duration for blacks and whites by industry of employment. The adjusted prevalence of short sleep duration was higher among blacks employed in the following industries than among whites employed in the same industries: finance/information/real estate (prevalence ratio (PR) = 1.44, 95% confidence interval (CI): 1.30, 1.59), professional/administrative/management (PR = 1.30, 95% CI: 1.18, 1.44), educational services (PR = 1.39, 95% CI: 1.25, 1.54), public administration/arts/other services (PR = 1.30, 95% CI: 1.21, 1.41), health care/social assistance (PR = 1.23, 95% CI: 1.14, 1.32), and manufacturing/construction (PR = 1.14, 95% CI: 1.07, 1.20). Prevalence of short sleep duration, however, was not different between blacks and whites in the retail trade industry (PR = 1.07, 95% CI: 0.96, 1.18) or in the accommodation/food services industry (PR = 1.05, 95% CI: 0.93, 1.19). Supplementary Data and 3 display trends in the adjusted prevalence ratios of short sleep duration in blacks compared with whites across the aforementioned industries of employment and occupations, respectively. Supplementary Data shows a black-white comparison of age-adjusted prevalence of short sleep duration by class of work and employment status.
Adjusted Prevalence Ratios of Short Sleep Duration for Blacks Compared With Whites by Industry of Employment (n = 41,088), National Health Interview Survey, 2004–2011
| Industry of Employment | Model 1a (Age) | Model 2b (Demographic Characteristics) | Model 3c (Health Behaviors) | Model 4d (Medical Conditions) | Model 5e (Occupational Characteristics) | |||||
|---|---|---|---|---|---|---|---|---|---|---|
| PR | 95% CI | PR | 95% CI | PR | 95% CI | PR | 95% CI | PR | 95% CI | |
| Manufacturing/constructionf | 1.20 | 1.15, 1.25 | 1.19 | 1.13, 1.25 | 1.20 | 1.14, 1.27 | 1.16 | 1.09, 1.22 | 1.14 | 1.07, 1.20 |
| Retail trade | 1.11 | 1.02, 1.21 | 1.12 | 1.03, 1.23 | 1.12 | 1.01, 1.24 | 1.07 | 0.96, 1.18 | 1.07 | 0.96, 1.18 |
| Finance/information/real estateg | 1.54 | 1.42, 1.67 | 1.49 | 1.37, 1.63 | 1.51 | 1.37, 1.67 | 1.44 | 1.31, 1.59 | 1.44 | 1.30, 1.59 |
| Professional/administrative/managementh | 1.38 | 1.28, 1.49 | 1.33 | 1.22, 1.45 | 1.39 | 1.26, 1.52 | 1.32 | 1.20, 1.46 | 1.30 | 1.18, 1.44 |
| Educational services | 1.60 | 1.48, 1.73 | 1.52 | 1.39, 1.66 | 1.51 | 1.36, 1.67 | 1.38 | 1.24, 1.53 | 1.39 | 1.25, 1.54 |
| Health care/social assistance | 1.32 | 1.25, 1.40 | 1.30 | 1.22, 1.38 | 1.31 | 1.22, 1.40 | 1.23 | 1.15, 1.32 | 1.23 | 1.14, 1.32 |
| Accommodation/food services | 1.06 | 0.96, 1.17 | 1.05 | 0.94, 1.17 | 1.09 | 0.96, 1.23 | 1.06 | 0.94, 1.20 | 1.05 | 0.93, 1.19 |
| Public administration/arts/other servicesi | 1.37 | 1.28, 1.46 | 1.39 | 1.29, 1.49 | 1.41 | 1.30, 1.52 | 1.30 | 1.20, 1.40 | 1.30 | 1.21, 1.41 |
Abbreviations: CI, confidence interval; NAICS, North American Industrial Classification System; PR, prevalence ratio.
a Model 1 is adjusted for age categories.
b Model 2 is adjusted for age categories plus sex, marital status, educational attainment, and living in poverty.
c Model 3 is adjusted for model 2 variables plus smoking status, alcohol consumption, and physical activity.
d Model 4 is adjusted for model 3 variables plus health status, body mass index (weight (kg)/height (m)2), hypertension, diabetes, heart disease, and cancer.
e Model 5 is adjusted model 4 variables plus class of occupation, occupation, and household income.
f Includes the following NAICS (NAICS Association, LLC, Rockaway, New Jersey) industry categories: agriculture, forestry, fishing, and hunting; mining; utilities; construction; manufacturing; wholesale trade; and transportation and warehousing.
g Includes the following NAICS industry categories: information; finance and insurance; and real estate rental and leasing.
h Includes the following NAICS industry categories: professional, scientific, and technical services; management of companies and enterprises; and administrative support and waste management and remediation services industries.
i Includes the following NAICS industry categories: public administration; arts, entertainment, and recreation; and other services (except public administration).
Trends in sleep duration by industry of employment
Figure 1 illustrates temporal trends in the age-adjusted prevalence of short sleep duration by industry of employment among both blacks and whites. Trends in short sleep prevalence were different for blacks and whites for the finance/information/real estate industry (P for interaction = 0.02) and for the professional/administrative/management industry (P for interaction = 0.04). The prevalence estimates of short sleep duration did not differ over the study period by race in any other industry. The consistently widest disparities in short sleep duration by race were observed among those in the educational services and finance/information/real estate industries.
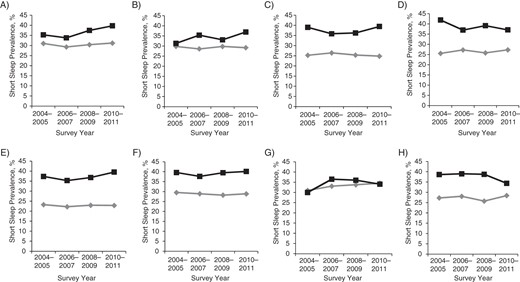
Trends in the age-adjusted prevalence of short sleep duration by industry of employment among blacks and whites, National Health Interview Survey, 2004–2011. A) Agriculture, forestry, fishing, and hunting; mining; utilities; construction; manufacturing; wholesale trade; and transportation and warehousing industries (P for interaction = 0.54; for whites, P for trend = 0.28; for blacks, P for trend = 0.65). B) Retail trade industry (P for interaction = 0.88; for whites, P for trend = 0.94; for blacks, P for trend = 0.84). C) Information; finance and insurance; and real estate rental and leasing industries (P for interaction = 0.02; for whites, P for trend = 0.55; for blacks, P for trend = 0.31). D) Professional, scientific, and technical services; management of companies and enterprises; and administrative and support and waste management and remediation services industries (P for interaction = 0.04; for whites, P for trend = 0.73; for blacks, P for trend = 0.41). E) Educational services industry (P for interaction = 0.06; for whites, P for trend = 0.90; for blacks, P for trend = 0.40). F) Health care and social assistance industry (P for interaction = 0.99; for whites, P for trend = 0.86; for blacks, P for trend = 0.45). G) Accommodation and food services industry (P for interaction = 0.10; for whites, P for trend = 0.86; for blacks, P for trend = 0.83). H) Public administration; other services; and arts, entertainment, and recreation industries (P for interaction = 0.75; for whites, P for trend = 0.32; for blacks, P for trend = 0.11). Diamonds represent whites and squares represent blacks.
Among whites in most industries (except health care/social assistance), laborers had the greatest prevalence of short sleep duration compared with individuals employed in support services or professional/administrative/management positions (see Table 3). Blacks had a consistently higher prevalence of short sleep duration than that of their white counterparts except for laborers in retail trade (for blacks, 26%; for whites, 34%) and in accommodation/food services (for blacks, 34%; for whites, 34%). Blacks in the professional/administrative/management industry category had the same prevalence of short sleep duration (38%) regardless of occupation. For blacks, the prevalence of short sleep duration was higher among professional workers compared with others in most industries; in contrast, among whites, the prevalence of short sleep duration was lower for those in professional roles compared with other occupational roles. Supplementary Data lists the prevalence of short sleep duration by occupation within industry among both black and white participants without reported diabetes, heart disease, or cancer. Furthermore, the results (main and interaction) for race and survey year by industry of employment are shown for optimal sleep duration in Supplementary Data and for short sleep duration in Supplementary Data.
Prevalence of Short Sleep Durationa by Occupation Within Industries Overall and Among Blacks and Whites, National Health Interview Survey, 2004–2011
| Occupation by Industry | Blacks | Whites | Total | ||||||
|---|---|---|---|---|---|---|---|---|---|
| No. | % | Short Sleep Prevalence, % | No. | % | Short Sleep Prevalence, % | No. | % | Short Sleep Prevalence, % | |
| Manufacturing/constructionb | 39,555 | ||||||||
| Professional/management | 426 | 7 | 39 | 7,004 | 21 | 26 | 7,430 | 19 | 27 |
| Support services | 1,100 | 17 | 40 | 6,959 | 21 | 27 | 8,059 | 20 | 28 |
| Laborers | 4,767 | 76 | 36 | 19,299 | 58 | 33 | 24,066 | 61 | 34 |
| Retail trade | 14,678 | ||||||||
| Professional/management | 63 | 3 | 35 | 727 | 6 | 24 | 790 | 5 | 24 |
| Support services | 1,822 | 78 | 37 | 9,528 | 77 | 29 | 11,350 | 77 | 30 |
| Laborers | 452 | 19 | 26 | 2,086 | 17 | 34 | 2,538 | 17 | 32 |
| Finance/information/real estatec | 12,655 | ||||||||
| Professional/management | 521 | 29 | 40 | 3,827 | 35 | 23 | 4,348 | 34 | 25 |
| Support services | 972 | 54 | 38 | 6,062 | 56 | 26 | 7,034 | 56 | 27 |
| Laborers | 323 | 18 | 35 | 950 | 9 | 30 | 1,273 | 10 | 31 |
| Professional/administrative/ managementd | 12,586 | ||||||||
| Professional/management | 444 | 20 | 38 | 5,013 | 48 | 25 | 5,457 | 43 | 26 |
| Support services | 736 | 34 | 38 | 3,279 | 32 | 26 | 4,015 | 32 | 28 |
| Laborers | 1,004 | 46 | 38 | 2,110 | 20 | 30 | 3,114 | 25 | 32 |
| Educational services | 13,763 | ||||||||
| Professional/management | 208 | 9 | 45 | 1,204 | 11 | 26 | 1,412 | 10 | 28 |
| Support services | 1,526 | 65 | 35 | 8,939 | 78 | 21 | 10,465 | 76 | 23 |
| Laborers | 597 | 26 | 38 | 1,289 | 11 | 31 | 1,886 | 14 | 32 |
| Health care/social assistance | 17,878 | ||||||||
| Professional/management | 292 | 6 | 43 | 1,390 | 10 | 26 | 1,682 | 9 | 28 |
| Support services | 3,624 | 79 | 40 | 10,925 | 82 | 29 | 14,549 | 81 | 31 |
| Laborers | 692 | 15 | 35 | 955 | 7 | 28 | 1,647 | 9 | 30 |
| Accommodation/food services | 7,615 | ||||||||
| Professional/management | 120 | 7 | 42 | 898 | 15 | 31 | 1,018 | 13 | 32 |
| Support services | 339 | 19 | 30 | 692 | 12 | 29 | 1,031 | 14 | 29 |
| Laborers | 1,301 | 74 | 34 | 4,265 | 73 | 34 | 5,566 | 73 | 34 |
| Public administration/arts/ other servicese | 16,905 | ||||||||
| Professional/management | 581 | 16 | 42 | 2,814 | 21 | 26 | 3,395 | 20 | 28 |
| Support services | 1,633 | 45 | 36 | 6,297 | 47 | 26 | 7,930 | 47 | 28 |
| Laborers | 1,398 | 39 | 37 | 4,182 | 31 | 30 | 5,580 | 33 | 31 |
| Total | 24,941 | 110,694 | 135,635 | ||||||
| Professional/management | 2,655 | 11 | 41 | 22,877 | 21 | 25 | 25,532 | 19 | 27 |
| Support services | 11,752 | 47 | 38 | 52,681 | 48 | 27 | 64,433 | 48 | 28 |
| Laborers | 10,534 | 42 | 36 | 35,136 | 32 | 32 | 45,670 | 34 | 33 |
Abbreviation: NAICS, North American Industrial Classification System.
a Weighted estimates.
b Includes the following NAICS (NAICS Association, LLC, Rockaway, New Jersey) industry categories: agriculture, forestry, fishing, and hunting; mining; utilities; construction; manufacturing; wholesale trade; and transportation and warehousing.
c Includes the following NAICS industry categories: information; finance and insurance; and real estate rental and leasing.
d Includes the following NAICS industry categories: professional, scientific, and technical services; management of companies and enterprises; and administrative support and waste management and remediation services industries.
e Includes the following NAICS industry categories: public administration; arts, entertainment, and recreation; and other services (except public administration).
DISCUSSION
We found that blacks had an overall age-adjusted prevalence of short sleep duration that was 9 percentage points higher than that for whites, and the difference in prevalence of short sleep duration between blacks and whites varied by both industry and occupation. We also found that, for most industries, differences in the prevalence of short sleep duration between blacks and whites narrowed among laborers but increased among professional workers; therefore, the prevalence of short sleep duration was more comparable among black and white individuals with lower socioeconomic status. Specifically, the prevalence of short sleep duration generally increased with increasingly professional roles within a given industry among blacks, whereas short sleep prevalence decreased with increasing professional roles for whites. Interestingly, blacks in the professional/administrative/management industry category had the same prevalence of short sleep duration regardless of occupation, and whites who were laborers in the retail trade industry were the only group to have a higher prevalence of short sleep duration than blacks, at 34% versus 26%, respectively (Table 3).
Our study, in combination with previous investigations, suggests that population patterns of sleep duration are likely influenced by complex aspects of the social and work environments, including features that are inequitably distributed (13, 44). A previous study found a high prevalence of short sleep duration among workers in the transportation/warehousing, manufacturing, and public administration industries and identified specific occupational groups within these industries with the highest prevalence of short sleep duration (13). The study adjusted for race and did not report on black-white differences. Sleep restriction, however, is a potential source of health inequity among races and is a modifiable population health determinant that deserves further investigation.
Several potential mechanisms may connect one's job (a marker of socioeconomic position) with one's overall health, because occupation influences specific sleep conditions through power, prestige, and access to resources (45, 46). There are also pathways that likely produce racial/ethnic disparities in health, with shorter, lower quality sleep among blacks being an important contribution. For instance, occupational status is influenced by educational attainment that creates differential access to and use of information and knowledge (health-related and other), and income creates differences through differential access to quality education, as well as to material goods and services. Stress related to limited social and material resources may negatively affect sleep.
Furthermore, racial/ethnic disparities in sleep may be propagated through differential exposure to social hazards in the workplace that produce or further exacerbate stressors that impair sleep. For instance, exposure to historical and contemporary forms of discrimination/harassment in the workplace and in society may play an important role in producing psychosocial stress, in addition to job strain or limited control over job demands/prestige, as illustrated by the well-known Karasek and Theorell demand-control model (38, 47–49). Additionally, shift work is more common in racial/ethnic minorities than in other groups (50, 51) and may help explain the observed racial differences in the prevalence of short sleep duration by industry and occupation, as well as the commonly observed flatter inverse gradients between some measures of socioeconomic status and various health outcomes among blacks compared with whites (52). Blacks have also been shown to have more risk factors for comorbid conditions (e.g., obesity, type 2 diabetes, sleep apnea) that may result in less, poorer quality sleep, and these health conditions have been shown to influence one's working conditions (53, 54).
With an increasing number of blacks entering into professional and management roles within any given industry, it would be useful to further investigate structural or macro-level social factors that contribute to the increasing prevalence of short sleep duration with increasingly professional roles among blacks. This is in contrast to the apparent decrease in prevalence of short sleep duration with increasingly professional roles for whites. Perhaps, the high prevalence of short sleep duration among professional blacks can be attributed, in part, to limited professional/social networks that can provide emotional and financial support, discrimination in the workplace, the perceived high work ethic needed to succeed, and/or greater levels of stress at home. An extraordinarily strong work ethic may emerge as a coping strategy in response to psychosocial and environmental stressors (e.g., career concerns, racism) when effort is not supported by potentially mitigating resources (e.g., financial and emotional support). This phenomenon is potentially damaging to health through, among other factors, shorter sleep duration, and has been referred to as John Henryism in the epidemiologic literature (55–57).
Our study has several limitations. For instance, we had a cross-sectional study design and were unable to investigate prospective associations between type of employment and sleep duration. We also relied on self-reported data, including data for sleep duration, whereas actigraphy and polysomnography (the “gold standard”) would provide more objective measures (58). A previous study has shown a moderate correlation (r = 0.45) between reported and measured sleep duration and (although more research is necessary) did not find that blacks differed appreciably in their sleep duration reporting error compared with whites (58). We did not have data on the number of children (neither young nor adolescent) living in the household, which could influence sleep and could differ by race. We also did not have access to data on medication use that may affect sleepiness. Further, employment status was based on participants being employed during the week prior to the interview, which can be more variable for lower–socioeconomic status, minority groups (59); therefore, studies capable of exploring the influence of job security on sleep disparities would be particularly useful. Lastly, our occupational categories may include considerable heterogeneity and likely correlate with wealth. Our categories may also include a disproportionate number of shift workers, a variable for which we were unable to adjust, although shift work has been shown to differ by race and to negatively affect sleep (16, 32, 60).
Despite the limitations, our study has important strengths. For instance, our data were based on a large sample size with a large minority population in which robust racial, industry, and occupational stratification, as well as modification testing for a priori factors of interest, was possible. We had sleep data from 8 consecutive years, which enhanced our power to investigate sleep disparities. Also, our data are nationally representative and recently collected. We also directly estimated prevalence ratios rather than odds ratios for easier interpretation.
In conclusion, differences in short sleep duration among blacks and whites varied by industry of employment and occupation and did not appear to change over the study period. High socioeconomic status among blacks does not appear to be protective against short sleep duration, but it does for whites. These findings suggest the need for further investigation of racial/ethnic disparities in the work-sleep relationship to develop strategies for management, as well as tailored interventions that address disparities and improve sleep for optimal health among US workers.
ACKNOWLEDGMENTS
Author affiliations: Department of Nutrition, Harvard School of Public Health, Boston, Massachusetts (Chandra L. Jackson, Frank B. Hu); Department of Medicine, Brigham and Women's Hospital and Beth Israel Deaconess Medical Center, Harvard Medical School, Boston, Massachusetts (Susan Redline, Frank B. Hu); Department of Social and Behavioral Sciences, Harvard School of Public Health, Boston, Massachusetts (Ichiro Kawachi); and Department of Epidemiology, Harvard School of Public Health, Boston, Massachusetts (Michelle A. Williams, Frank B. Hu).
F.B.H., S.R., and C.L.J. were supported by Harvard Transdisciplinary Research in Energetics and Cancer (grant 1U54CA155626-01). The funding source was not involved in the data collection, data analysis, manuscript writing, or publication.
This work was presented as a poster at the 46th Annual Society for Epidemiologic Research meeting in Boston, Massachusetts, June 18–21, 2013.
Conflict of interest: none declared.
REFERENCES
Author notes
Abbreviations: BMI, body mass index; CI, confidence interval; NAICS, North American Industrial Classification System; NHIS, National Health Interview Survey; PR, prevalence ratio.

